GCC Markets - Who created value in the medium/long-term?

Marmore Team
18 November 2015
The main goal of an investor or a money manager is to create wealth – be it through capital appreciation strategy, dividend strategy or a capital preservation strategy. Unfortunately over the last 10 year period (2005-October 2015) all but Muscat stock exchange failed to create wealth for investors . That said, looking at the 5 year data, UAE and Qatar posted remarkable returns compared to its peers. Dubai and Abu Dhabi posted 16% and 11% five year CAGR respectively while Qatar posted 9% during the same period the main catalyst for Qatar and the UAE was the inclusion of their respective markets in MSCI EM Index. Assuming investors picked a passive strategy, they would have failed to create wealth over the 10 year period (except Oman) and the 5 year period (barring UAE and Qatar).
While at a macro level markets did not create value, at a stock level we have many winners and losers. After dissecting the stock universe based on size (large, mid and small), we applied liquidity filter (to weed out illiquid companies) to see how they stack up. Here are the results of GCC value creators.
Large Cap GCC companies
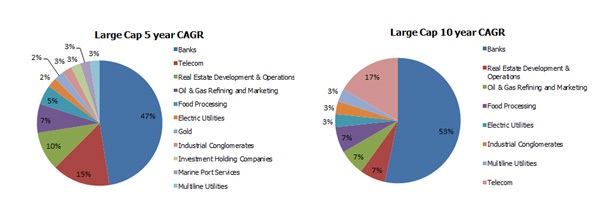
We identified 30 large cap companies for our 10 year analysis and 40 companies for our 5 year analysis dominated mostly by banks followed by Telecom. Over the past 10 years, large caps yielded a CAGR of -4% (the range was between +14% and -10%). The range was more pronounced in the 5 year period, during which GCC large caps posted returns ranging between +34% to -23%. However on an average, GCC large cap companies posted +7% (5 year CAGR).

Banks dominated over the 5 and 10 year period
Source: Reuters and Marmore, the chart shows the dominance of each sector, measured by the total number of companies in our study
Mid Cap GCC companies
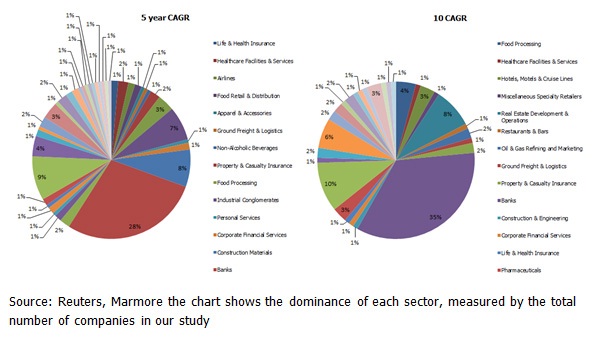
Most money managers will focus on large and medium cap companies within their asset allocation strategy since small cap companies are considered risky. Had they invested in mid cap companies, would money managers have outperformed top heavy allocations? In short, yes, since mid cap companies performed better than large caps on both 10 and 5 year periods. Over the 10 year period the CAGR was -2% (50% less than large caps) while 5 year average CAGR was slightly better than large caps at 8% In this study we identified 144 companies that fit our criteria for the 5 year period and 98 companies that fit our 10 year period criteria.

Banks dominated the scene in the 5 year term however in the long run (10 years) retail had the largest share of companies that fit our criteria

Small Cap Companies
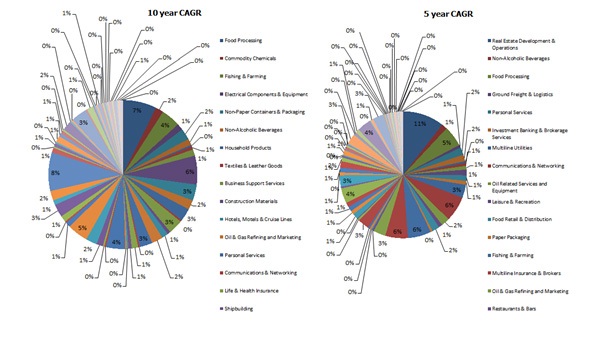
In our study of small cap companies, 418 companies matched our 5 year criteria and 287 companies matched our 10 year criteria. On average small caps destroyed wealth, be it during the medium term investment period of 5 years or a long term period of 10 years. GCC small cap destroyed wealth on average by -1% CAGR during the 5 year period and -6% during the 10 year period.
The ranges of returns were the highest among the 3 classifications (large, mid and small cap). In the 5 year CAGR timeline, GCC small caps posted a high of 41% and a low of -39%. When pulling the data further to 10 years, the range of return was quite similar +44% to -36%.

No significant leader in the 5 and 10 year sphere as plethora of companies are represented in the small cap sphere

Source: Reuters, Marmore the chart shows the dominance of each sector, measured by the total number of companies in our study
Final Words
All in all, GCC market performance over the past decade was negative. Over the past 5 years, only large and medium cap companies created value (based on our liquidity criteria). Moreover, banks clearly dominated the pool of sectors. That said investors should evaluate their investment strategy annually and make appropriate changes to avoid capital loss. Our experiment shows that simply being a long term dormant investor does not work as everything changes with time and so should our investment strategy and outlook. Passive investors who invested in 2005 have no edge over people who invested in 2010 or few years ago.
Stay Tuned To Marmore MENA Insights!
Never miss a patch or an update with Marmore's Newsletter. Subscribe now!
Related Article
The uptick in MENA Eurobond issuances – A sign of things to come?
MENA debt issuances have touched record highs in Q1 2025. Will the uptick continue in subsequent quarters?
Read MoreKuwait’s Approval of Public Debt Law: Re-emerging on Investors’ Radar
Kuwait has passed the long-awaited debt law in March 2025. The blog explores the importance of the law, the expected benefits and outlook for the countrys return to debt markets.
Read MoreThe Dynamic Rise of Fintech in the GCC
The convergence of technology and finance is reshaping the GCC Financial Ecosystem. The blog explores key players, regulatory framework and market dynamics of Fintech in the GCC region.
Read More


