
SABIC was established in 1976 by Royal decree, and is currently ranked amongst the world’s largest petrochemicals manufacturer. According to Marmore’s company report on SABIC, the petrochemical segment contributed over 86% to SABIC’s revenue in 2014. The next big segment in terms of revenue is the minerals/metals segment, generating over 5% of the revenue. From 2010-14, the revenue from all the four business segments has grown at CAGR of 6%.
Revenue – Remain flat post stellar numbers in 2011
The total revenue of SABIC has increased after 2009 as the global markets recovered post the 2008 recession. According to the Global Platts Petrochemical Index, petrochemical prices declined by 30% in 2014 compared to 2013 price levels. The primary reason for the drop in sales in 2014 is the decline in oil prices in the last quarter of 2014, resulting in drop in the petrochemical product prices. Revenues have continued to decline during the 1st 9 months of 2015, dropping by 20% YoY (2014 9M earnings $ 38,788 Mn). Drop in revenues was attributed to the drop in selling prices of the petrochemical and other products that the company sells. While the company has not officially stated a reason for the decline in the prices of its products, it can largely be attributed to the falling oil prices.
Figure 1: Total Revenues 2010-15 (USD Mn)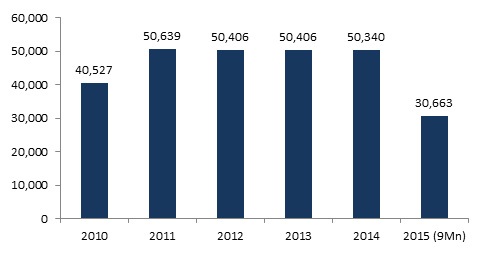
Source: Reuters
The petrochemical and fertilizer segment contributed over 86% to SABIC’s revenue in 2014. The next big segment in terms of revenue is the minerals/metals segment, generating over 6% of revenue. Throughout 2010 to 2014 petrochemical segment has generated revenue in excess of 80% of the company’s total revenue. SABIC is focused to be the leading player in this segment of business and almost 70% of the plant capacity was utilized to manufacture products which are part of the petrochemical business.
The operating profit margin of SABIC has witnessed a decline since 2011. Following record revenues in 2011 the operating profit margin reached 26% while in the subsequent years they were hovering between 22%-23% before falling to 20% in 2014. The Net profit margin has also followed a similar pattern. While the revenues for the 1st 9 months of 2015 fell by over 20% the net profit margin fared slightly better compared to the same period last year. Net profit for 2015 9M stands at 13.66% as against 13.11% during 2014 9M while the operating profit declined from 21.53% to 20.89% during the same period. The improvement in net profit margin could be attributed to the cost cutting that the company has managed during 2015.
Figure 2: Operating profit and Net profit 2010-15 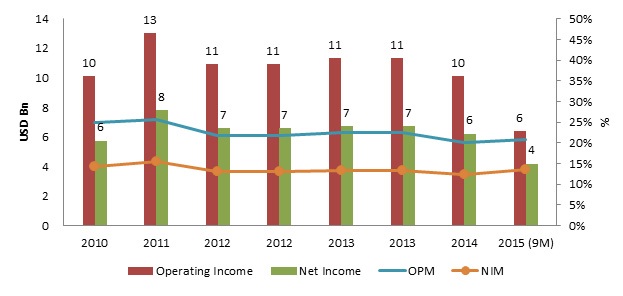
Source: Reuters
ROE (Return on Equity) – ROA (Return on Assets) – In line with Revenues
According to Marmore’s company report on SABIC, both ROE and ROA trends have been consistent with SABIC’s revenue. The ROE and ROA reached its peak in 2011 at 14.80% and 22.60%, respectively, before declining in 2012. Continued slow global economic growth in 2014, malaise in China (one the key markets for SABIC) and decline in product prices due to lower oil prices has reflected in the revenues and earnings of 2014. However, an increase in equity and a marginal increase in assets value in 2014 resulted in lower ROE and ROA relative to 2013. Though the likelihood of outperforming in the near to medium term are high due to the cyclical recovery and potential for structural recovery in its European operations and new investments in the pipeline, the lower oil prices resulting in lower products prices can be a major hindrance to the recovery.
Figure 3: ROE & ROA, (2010-14)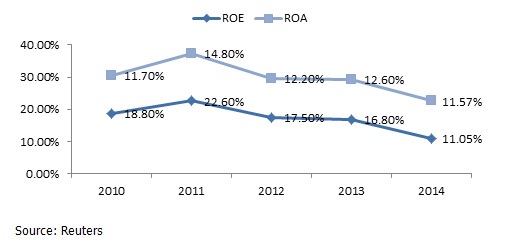
Share Performance
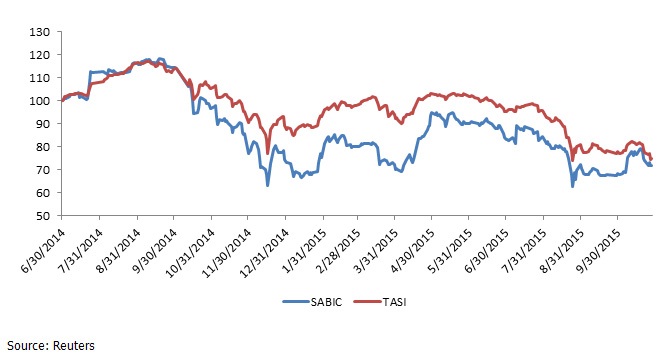
SABIC’s share performance has seen wide swings this year. While the share price continued to increase during the 1st half of the year it started to decline in the 2nd half of the year largely due to the negative impact that the Chinese stock market had on global stock markets. SABIC reached its peak of 108.75 on 04th May 2015 before falling to a low of 72 on 24th Aug 2015. It ended at 82.25on Oct 28th 2015. The Saudi Stock index’s performance has been even more underwhelming; TASI reached its peak of 9,834.39 on 30th April 2015 before falling to 7,024.6 on 24th August 2015. TASI ended at 7,118.42 on Oct 28th 2015. Year to date returns of SABIC and TASI has been negative at -2.1% and -14.6% respectively.
Figure 4: SABIC Share Performance (YTD – 2015) – Rebased