Saudi Corporate Capital Spending - An Encouraging Boost to Non-Oil GDP

Marmore Team
30 July 2019

Capital Investment is a harbinger of future growth as the fruits from today’s investments will appear in the future. Saudi Corporate sector has invested large resources in capital expenditure in 2018 which is much higher than their total net income earned during the year. The Corporate sector as represented by 120 (non-financial) listed Companies included in Tadawul All Share Index (TASI) of Saudi Stock Market, was examined to measure change in Property, Plant & Equipment (PPE), gross of depreciation (Capex) and also change in the net income during the last five fiscal years.
Findings from the Sector Analysis
The analysis shows that on overall basis, the Saudi Corporate sector has undertaken capital investments larger than tits net income in the year 2017-2018. The non-financial corporate sector invested USD 22.8 billion in 2018 which was about 5.2% of outstanding gross PPE as of 2018. The sector invested capital assets equivalent to 1.5x the net income generated in the Year.
The Corporate Capex will have GDP benefits not only directly from increase in Corporate Sector output but also spin off benefits from other sectors of the economy such as Banking, Construction, Capital Goods, Steel and Cement, and Consumer sectors that will benefit from the spending on account of distribution of part of the additional output in the form of salaries and wages. Thus, the Corporate Capital spending will drive the government’s efforts to grow the non-oil economy and to diversify the country’s investments and revenues away from oil sector. Saudi Corporate investment in Capital Capex also signals generation of new employment opportunities and a spur to the country’s economic stability and growth.
Directly, the Corporate Capex in 2018 can increase the Corporate sector revenues in the following years i.e. 2019 onwards by USD 8,884 million (by 6.6%) and the sector Net Income by USD 772 million (by 5.1%) if operated at its full utilization, based on the average Revenue-to-Investment and Net Income-to-Investment ratio for the Saudi Corporate Sector during the past 5 years of 2013-2018.
Industry Groups & their Capital Spending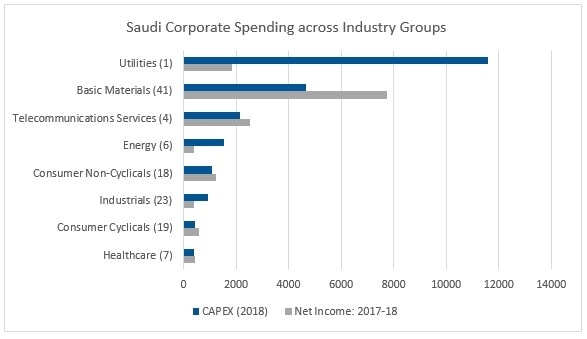 Source: Reuters & Marmore analysis
A closer look at the Corporate Capital Spending, shows that some of the Industry Groups have invested more than their Net Income for the year while some have invested less than their Net Income.
The groups that invested more than their net income are Utilities (Electricity Generation), industrials (which includes cable manufacturing and airline catering), and energy (that includes petroleum refining, gas stations and transportation of refined products). The higher spending of utilities is explained by the lower income for the sector due to subsidized power which results in comparatively lower net income for a given level of Capital investment, as compared to commercially run sectors like Petrochemicals and Cement. Also, petroleum refineries (energy) is a sector in which investment has to be done in large single block, necessitating capital investment bigger than net income. Also, due to longer life of refining assets, the net income compared to investment is smaller, meaning capital investment must be larger than the net income. The remaining groups i.e. Basic Materials (that includes Petrochemicals, Cement etc.), Telecommunications, Consumer cyclicals (that includes building products, hospitality etc.) and Consumer non-cyclicals (that includes dairy and agriculture products) invested less than their net income. Healthcare had capital spending almost equal to net income. The reason for Capital Investment less than net income for some of these sectors may be due to modular additions in multiple plants owned by petrochemicals, higher net income to assets ratio in the case of consumer cyclicals and consumer non-cyclicals, and modular increases feasible in telecommunications.
Capital Investment allocation vs Gross Return on Assets
The CAPEX and Gross ROA sectors are presented in the table below: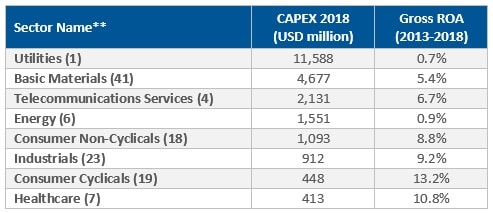 Source: Reuters & Marmore analysis
** numbers in parenthesis are number of companies
In terms of Gross ROA (measured as Net Income divided by Gross PPE), the largest capital spender, which is Utilities that however, had the lowest Gross ROA of 0.7% for the 5 years of 2013-2018. The investment despite the low ROA, may be explained by the strategic nature of these investments as well as their importance for economic growth in other sectors and longer life compared to industries like petrochemicals (Basic Chemicals). Further, power is provided at subsidized rates that results in low Gross ROA for the utilities sector. The next largest capital spending group is Basic Materials (mainly petrochemicals) that had a Gross ROA of 5.4% which is lower compared to other manufacturing assets ranked lower by capex additions. The lower ROA of the petrochemical industry can be attributed to lower benchmark return due to its operation in international markets involving lower cost of capital and higher competition. The third largest capital spender is telecom but it also had a comparatively lower Gross ROA of 6.7% that is again explained by its advantage of assets with longer life and stable returns and constraints from a highly competitive environment. Energy sector was the fourth largest and had a Gross ROA of 0.9% like utilities. Again, the extremely low ROA may be attributed to comparatively longer life for refinery assets, international market with low benchmark cost of capital and as it is a strategic asset for sale of country’s crude oil on value added basis. Lastly, the high investment allocation in these four sectors is to be viewed also from the size of the investment opportunity which is high in the case of all the largest four sectors mentioned, as they are capital intensive in nature.
Low capital-intensive sectors like Consumer Non-Cyclicals and Consumer Cyclicals which structurally do not need large sized investments followed next in the size of capital spending. Consumer non-cyclicals was fifth largest in capital spending and had Gross ROA of 8.8%, followed by Industrials at sixth place that had Gross ROA of 9.2%, and Consumer Cyclicals at seventh place with Gross ROA of 13.2%. Despite the Consumer non-cyclicals and Consumer Cyclicals having showed negative growth for past two years, the capital spending is positive and this indicates a potential uptick in the coming years. Also, though size of Capex was comparatively small, these sectors enjoy higher ROA.
The smallest Capital Spending group which was Healthcare had a Gross ROA of 10.8%. Healthcare sector was last in the size of investments but had a high PPE growth of 12.9% in 2018 that shows expectations of demand growth in future though 2018 did not see revenue growth. The Industrials was sixth in investment size, but PPE growth was again high at 16.0% showing potential in coming years despite fall in revenues in 2018.
On overall basis, the Gross ROA for the Corporate Sector was 4.0% The potential revenue increase as well as the net income increase in future at full utilization by each industry group, estimated based on average ratio of revenue to investment and net income margin for the respective industries is presented as below:
Potential Increase in Revenues/Profits: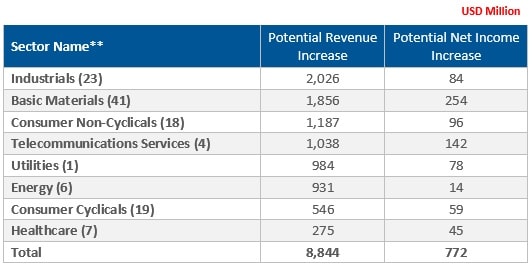 Source: Reuters, Marmore analysis
** numbers in parenthesis are number of companies
Conclusion
All said, Saudi Corporate sector investment in Capital assets during 2018 is encouraging, shows business confidence and bodes well for better corporate revenues followed by profits in the coming year. The Corporate sector through its growth will contribute to the economy’s goals for employment generation and economic diversification. The investments in infrastructure like power would pave the way for better industrial growth planned for the economy. However, it is observed that the incremental returns on investment for the Corporate sector may be low due to low returns for utilities (which has largest share of total investments) based on current business conditions. But then the government is actively pursuing policies for removal of subsidies and therefore the present returns for utilities may not represent future conditions.