Sources of Stock Market Wealth Creation: 3 Distinct Case Studies

Marmore Team
05 October 2016

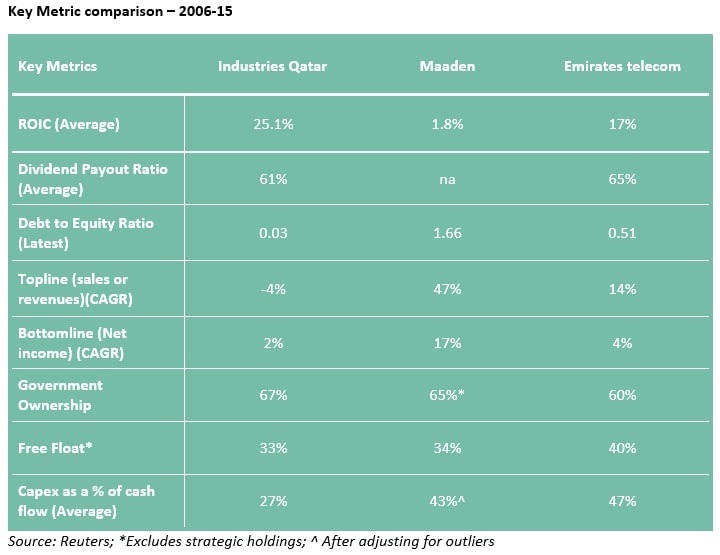
Cash flows, ownership structure and free float shares of the company combined affect the dividend policies of the company. Industries Qatar for instance is majority owned by the government of Qatar. Traditionally regional governments’ have held majority stake in companies that deal in natural resources in the region. Industries Qatar is a good example of the role that government ownership plays in dividend policies. The government of Qatar owns close to 67% of the company and thus enjoys higher say in formulating the dividend policies of the company which could be one of the reasons behind higher dividend pay-out ratio (60% till 2014). Qatar’s budget revenues consist of income from oil& gas, investment income and other incomes with investment income alone accounting for 30% of the revenues in 2015. Dividends from Industries Qatar roughly account for 6% of the investment income (majority of the dividends comes from Qatar Petroleum). As a result dividends serve as an important source of income for the government. Qatar government then spends this on developing the infrastructure in the country which goes in line with Industries Qatar’s dividend policies which lists sharing part of the wealth generated in the oil and gas segment with its shareholders as a key objective. As a result, the average pay-out ratio of dividends for the company till 2014 stands at 60%. Its capex as a % of cash flow from operating activities averages 27% over the observation period which suggests that the company has been generating enough cash flows to fund its capital expenses, liquidity, and withstand unexpected trading conditions. Positive cash flows has prevented the company from seeking outside capital for running its business and the company has used the positive cash flows to pay off some portion of its debt over the past four years. Revenues for the company peaked in 2012 following which it has witnessed a declining trend. Its three main segments: Petrochemical, Fertilizer and Steel have witnessed revenue declines of -13.5%,-9.7% and -12.4% during 2015. Weakness in oil prices has had an impact on prices of petrochemicals as well as fertilizers. Steel prices have suffered from global oversupply and weakness in key construction markets. Despite a lull in both top line and bottom line, the company has had positive cash flows from its operating activities which has been enough to cover its capital spending and pay dividends to its shareholders.
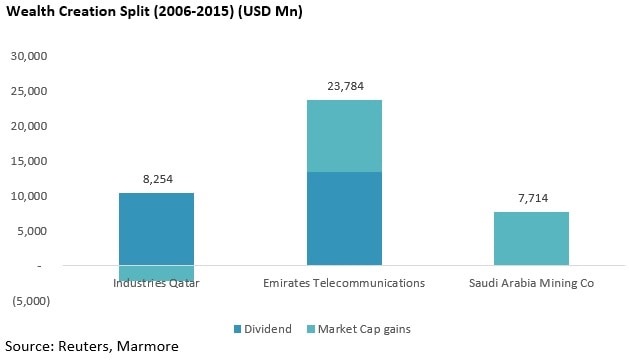
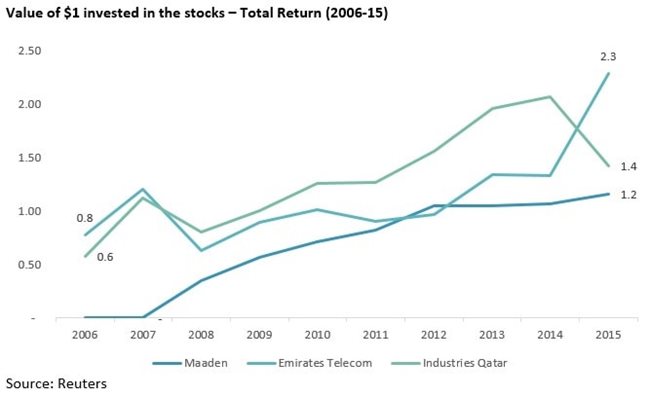
In contrast, Saudi Arabia Mining Company (Maaden) did not pay dividends at all during the period of study and therefore its wealth creation has entirely come from capital gains. This is despite Saudi government holding 65.42% of the company (direct holdings – 15.43% and public investment fund – 49.99%). Maaden’s operating cash flows have been positive however owing to its nature of its business it is required to invest a significant amount in securing future supply of mines. As a result of this, the company resorts to external borrowing since the cash flow from operations is not enough to cover its capex. From being debt free in 2008 it currently has a debt equity ratio of 1.66 times, significantly higher than the industry median of 0.45 times. Over the ten year period (2006-15) Maaden has cumulatively invested close to USD 20Bn on purchase of fixed assets, exploration of mining assets, project expansion etc. Its total debt issuances for the period amounts to USD 12.1B and almost of half of that has gone into purchase of fixed assets (USD 6Bn). Because it is cash negative due to high capex, it did not pay any dividends. However, exceptional topline and bottomline growth on the back of increase in price of the commodities has fuelled the growth of the share price over the years as a result of which all of the shareholders gains have been through capital appreciation. Maaden’s topline grew by 47% during 2006-15 which was largely driven by the growth in volumes in its key commodities i.e. Ammonia, Gold and Aluminum. Net profits grew at an annualized rate of 17% and would have been higher were it not for increase in selling/general and administrative expenses especially from freight and overhead charges. Industries Qatar and Maaden have managed to return 3.6% and 1.5% (CAGR) respectively.
Emirates Telecommunication (Etisalat) is one of the two major telecom operators in the UAE which is 60% owned by the Emirates Investment Authority while the rest is owned by institutional investors and general public. Etisalat’s dividend policy has been a generous one and positive cash flows from operations have ensured that it remains the same over the years. Etisalat has faced 5 instances when its market cap has declined on a YoY basis. Despite this the company’s stock has managed to add wealth to its shareholders fuelled by healthy growth in UAE in mobile and data segment. Analysing the cash flow statement reveals that the company has enough operating cash flows to cover its capital expenditures and overseas business acquisition. In the past ten years it has raised debt amounting to USD 7.5 Bn and close to 57% of the debt was raised in 2014. Net margins have remained in double digits over the years despite the saturation in the market owing to limited competition in the market (UAE has only two mobile operators). As a result of this the Return on Invested capital has managed to stay at higher levels.
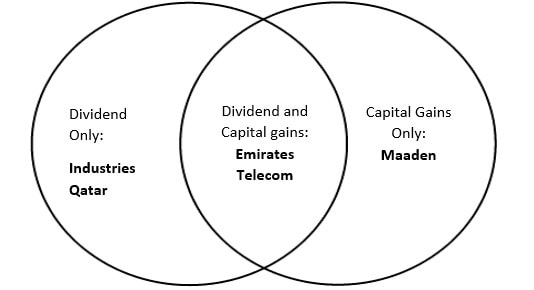
The three case studies discussed here represent three models of wealth creation viz., only through dividends (Industries Qatar), only through Capital Gains (Maaden) and a combination of the two (Etisalat). As they say, dividends and capital gains are the two main pillars of wealth creation. A balanced contribution of both dividends and capital gains (like Etisalat) can result in robust long-term wealth creation than to depend on just one leg of wealth creation (like Maaden and Industries Qatar). This is borne out by their total return performance (see chart). While devising an investment strategy, it may be worthwhile to favour stocks that generated wealth for shareholders through a judicious combination of both pillars (dividends and capital gains) than just one. While 3 stocks may be too small a sample size, however the argument of balanced contribution from both sources of wealth creation still holds.
Stay Tuned To Marmore MENA Insights!
Never miss a patch or an update with Marmore's Newsletter. Subscribe now!
Related Article
The uptick in MENA Eurobond issuances – A sign of things to come?
MENA debt issuances have touched record highs in Q1 2025. Will the uptick continue in subsequent quarters?
Read MoreKuwait’s Approval of Public Debt Law: Re-emerging on Investors’ Radar
Kuwait has passed the long-awaited debt law in March 2025. The blog explores the importance of the law, the expected benefits and outlook for the countrys return to debt markets.
Read MoreThe Dynamic Rise of Fintech in the GCC
The convergence of technology and finance is reshaping the GCC Financial Ecosystem. The blog explores key players, regulatory framework and market dynamics of Fintech in the GCC region.
Read More